The strategy is designed to manage exposure across market regimes. Its objective is not constant outperformance, but reduced drawdowns and more stable long-term compounding. Periods of relative outperformance typically emerge during market stress and are preserved during subsequent expansions.
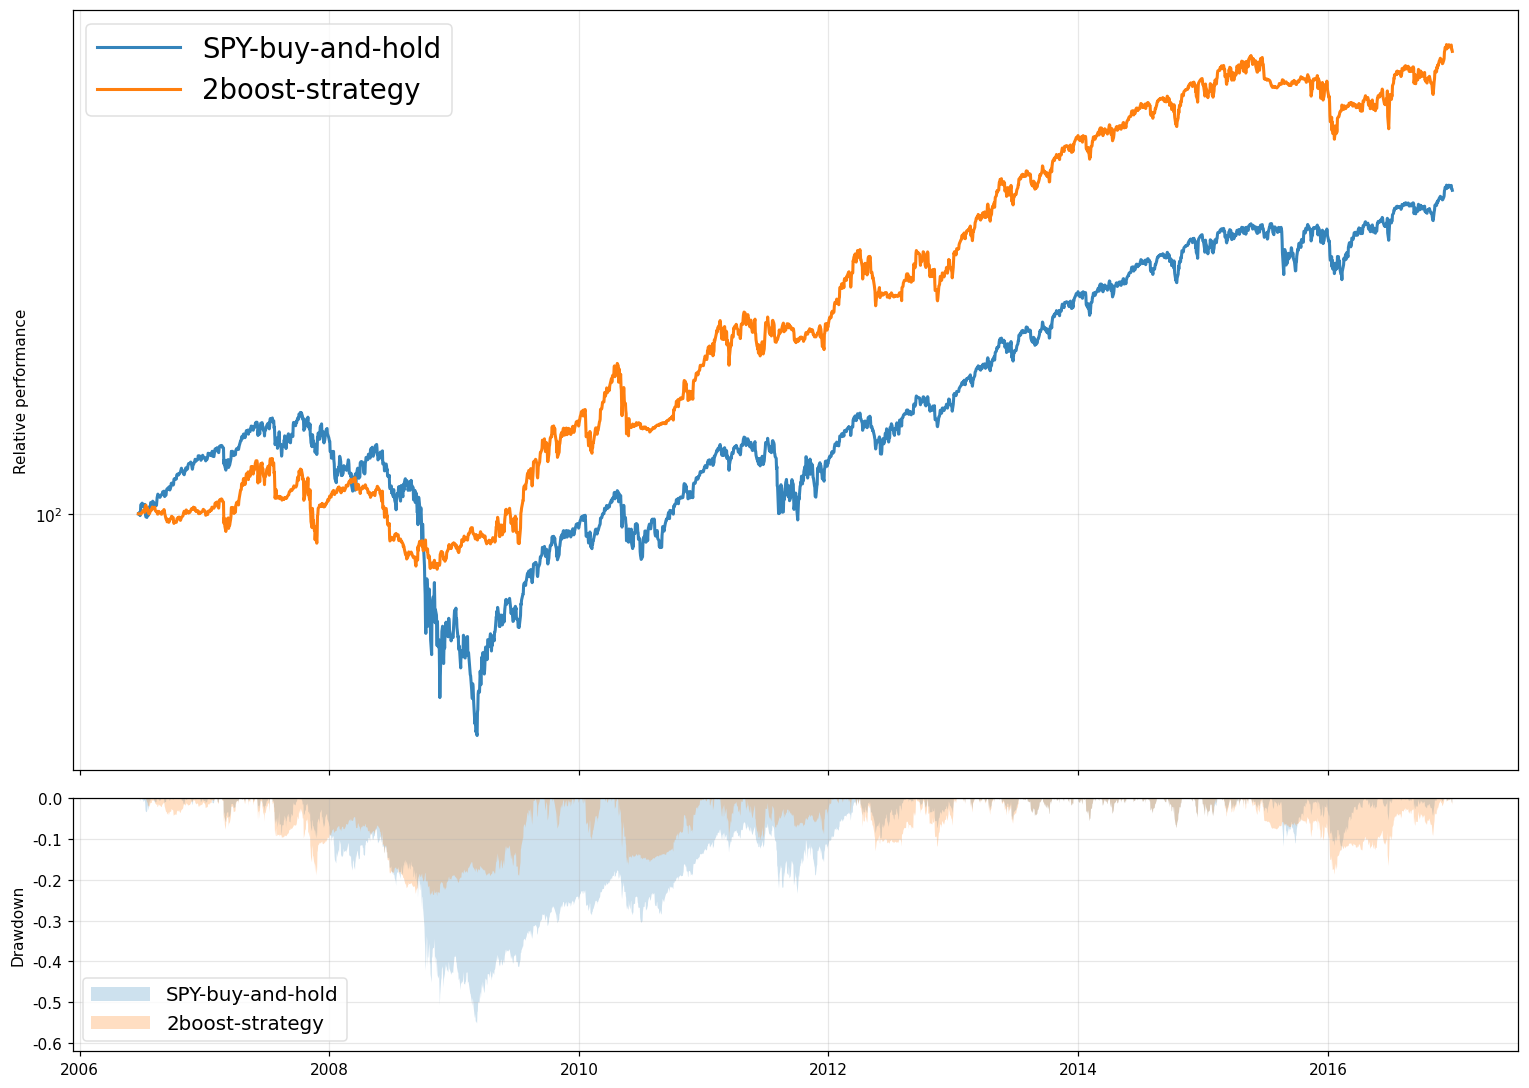
In-Sample Testing
Period: 22 Jun 2006 – 31 Dec 2016
This phase represents the model’s performance during the development and optimization window.
| Metric | Value |
|---|---|
| CAGR | 11.54% |
| Volatility | 15.79% |
| Sharpe Ratio | 0.77 |
| Maximum Drawdown | -24.04% |
| Final Multiple | 3.15× |
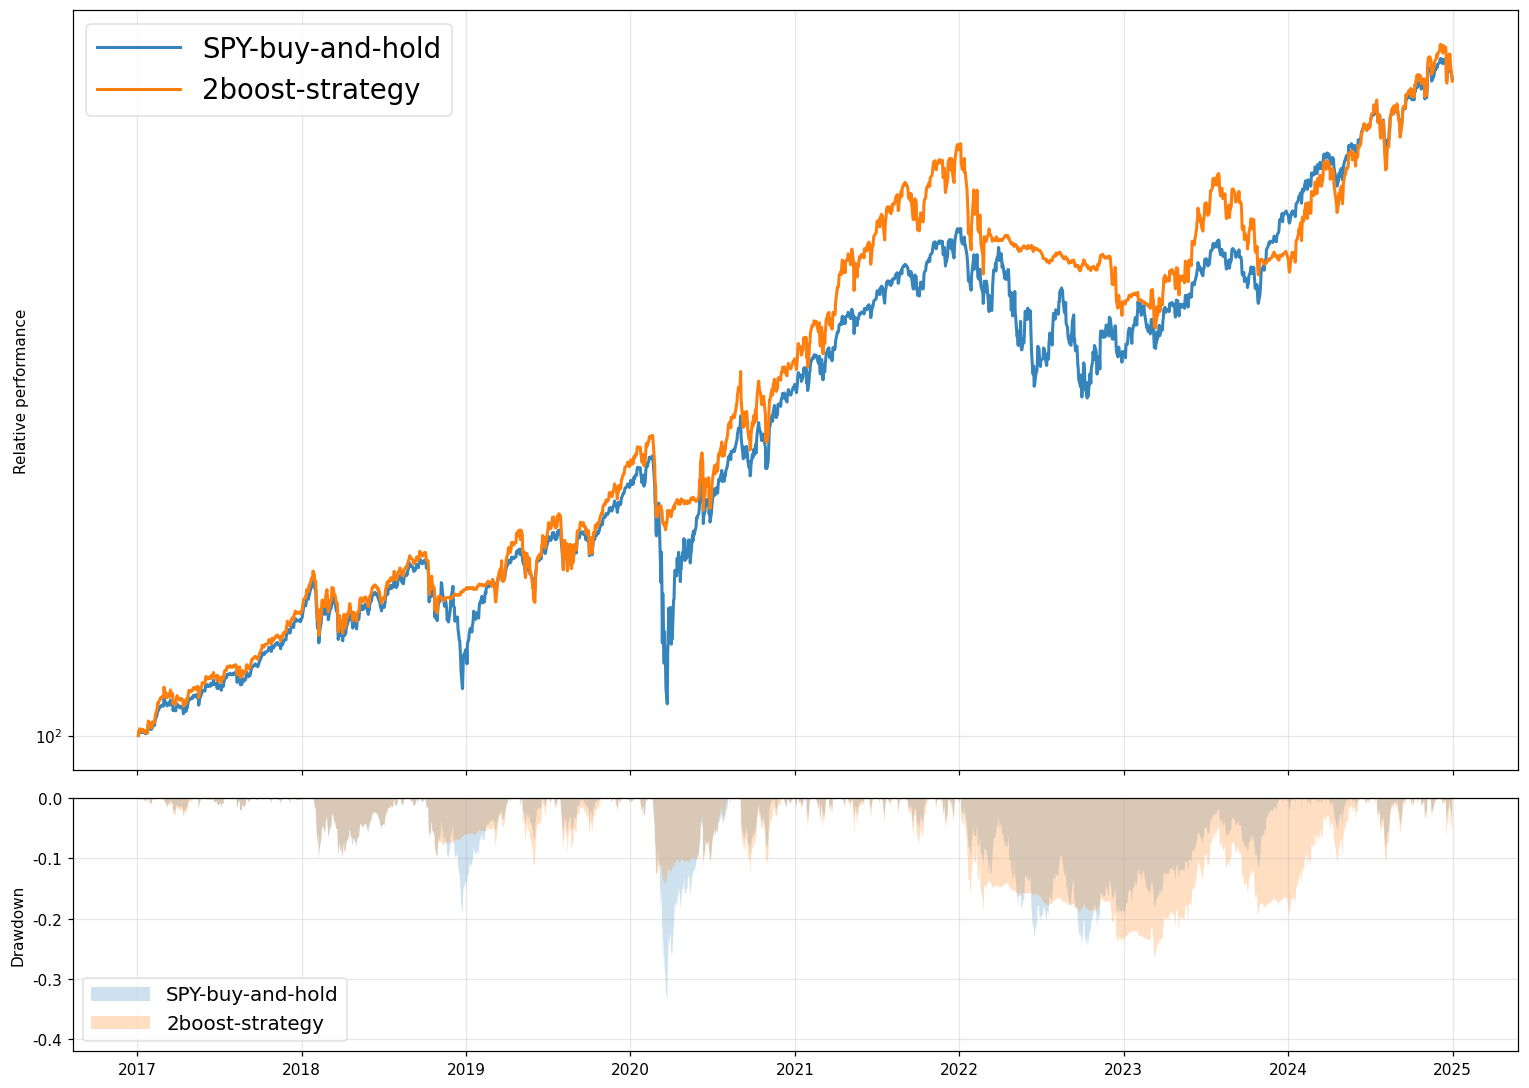
Out-of-Sample Testing
Period: 01 Jan 2017 – 31 Dec 2024
To prevent curve-fitting, we tested the model on unseen data from future cycles.
| Metric | Value |
|---|---|
| CAGR | 14.56% |
| Volatility | 16.22% |
| Sharpe Ratio | 0.92 |
| Maximum Drawdown | -26.33% |
| Final Multiple | 9.43× |
Disclaimer: Backtests are based on historical data and assume ideal execution conditions. Real-world results may differ due to market conditions, liquidity, and execution constraints.