The strategy was developed and evaluated using historical Kraken XBTUSD data across multiple market cycles since 2017.
In-Sample Testing
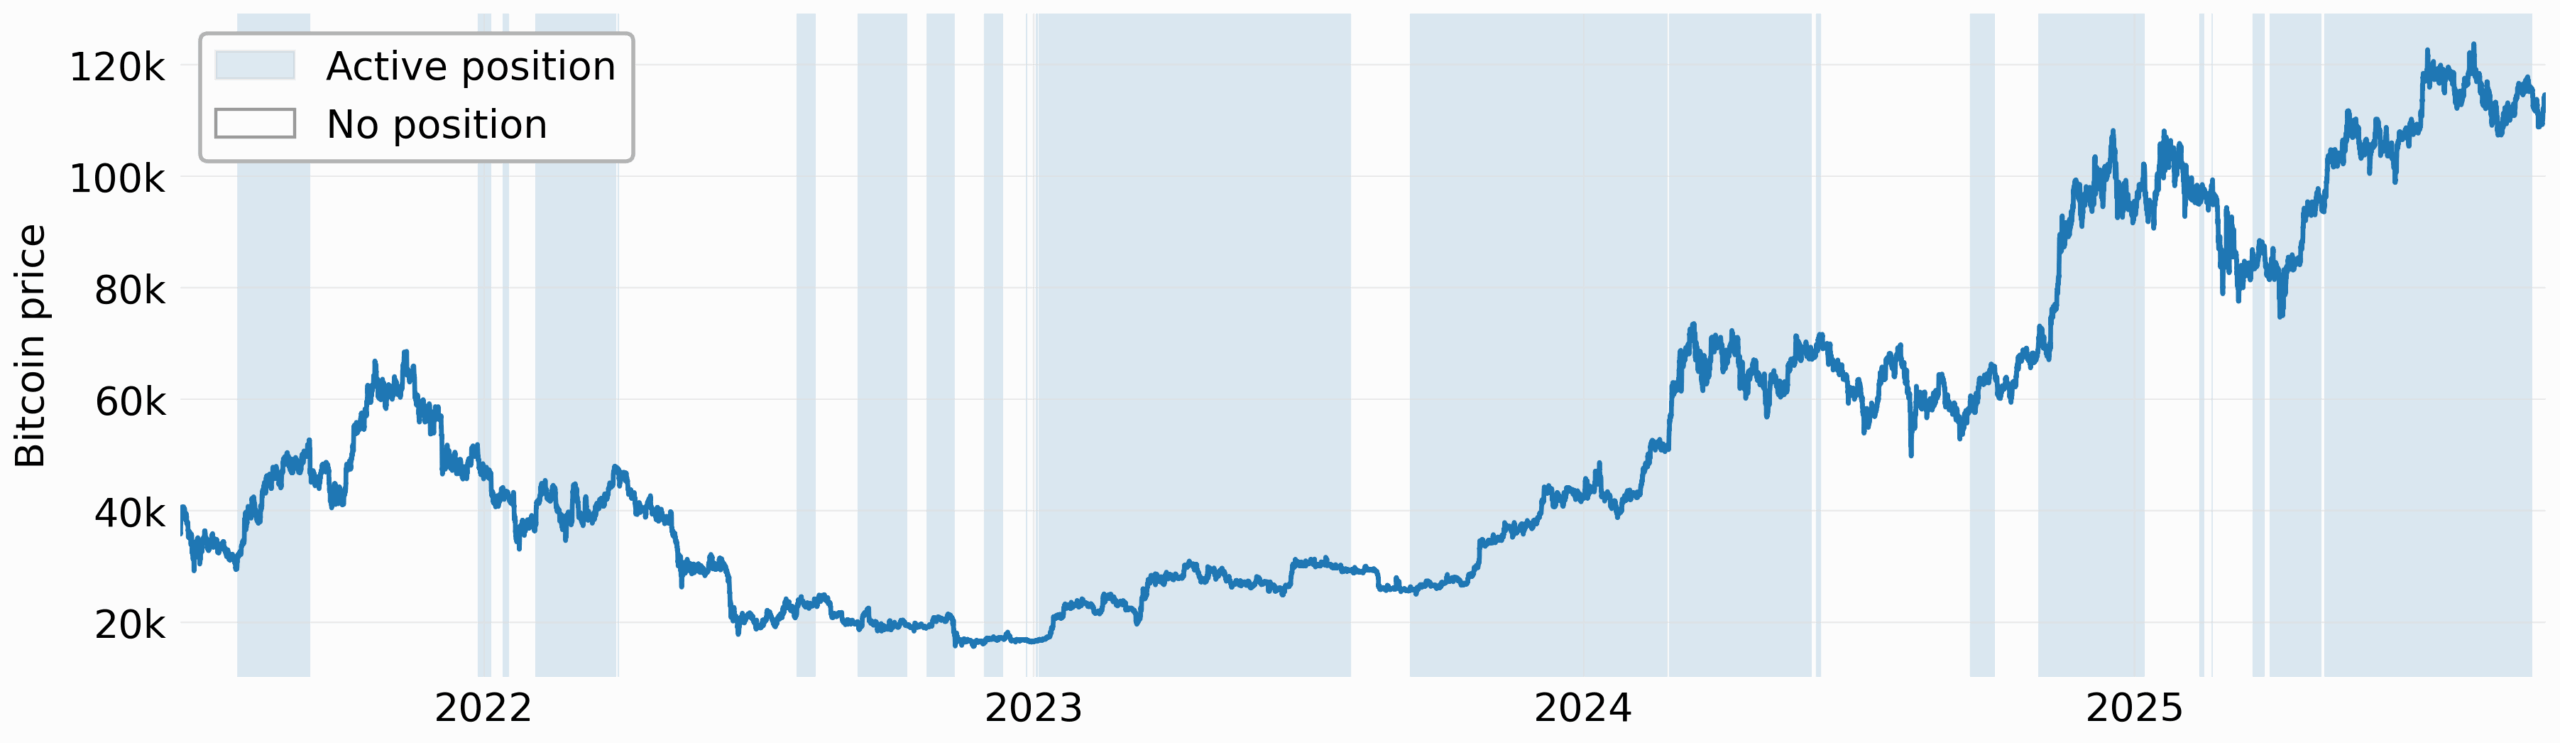
Period: 13 Jun 2021 – 30 Sep 2025
This phase represents the model’s performance during the development and optimization window.
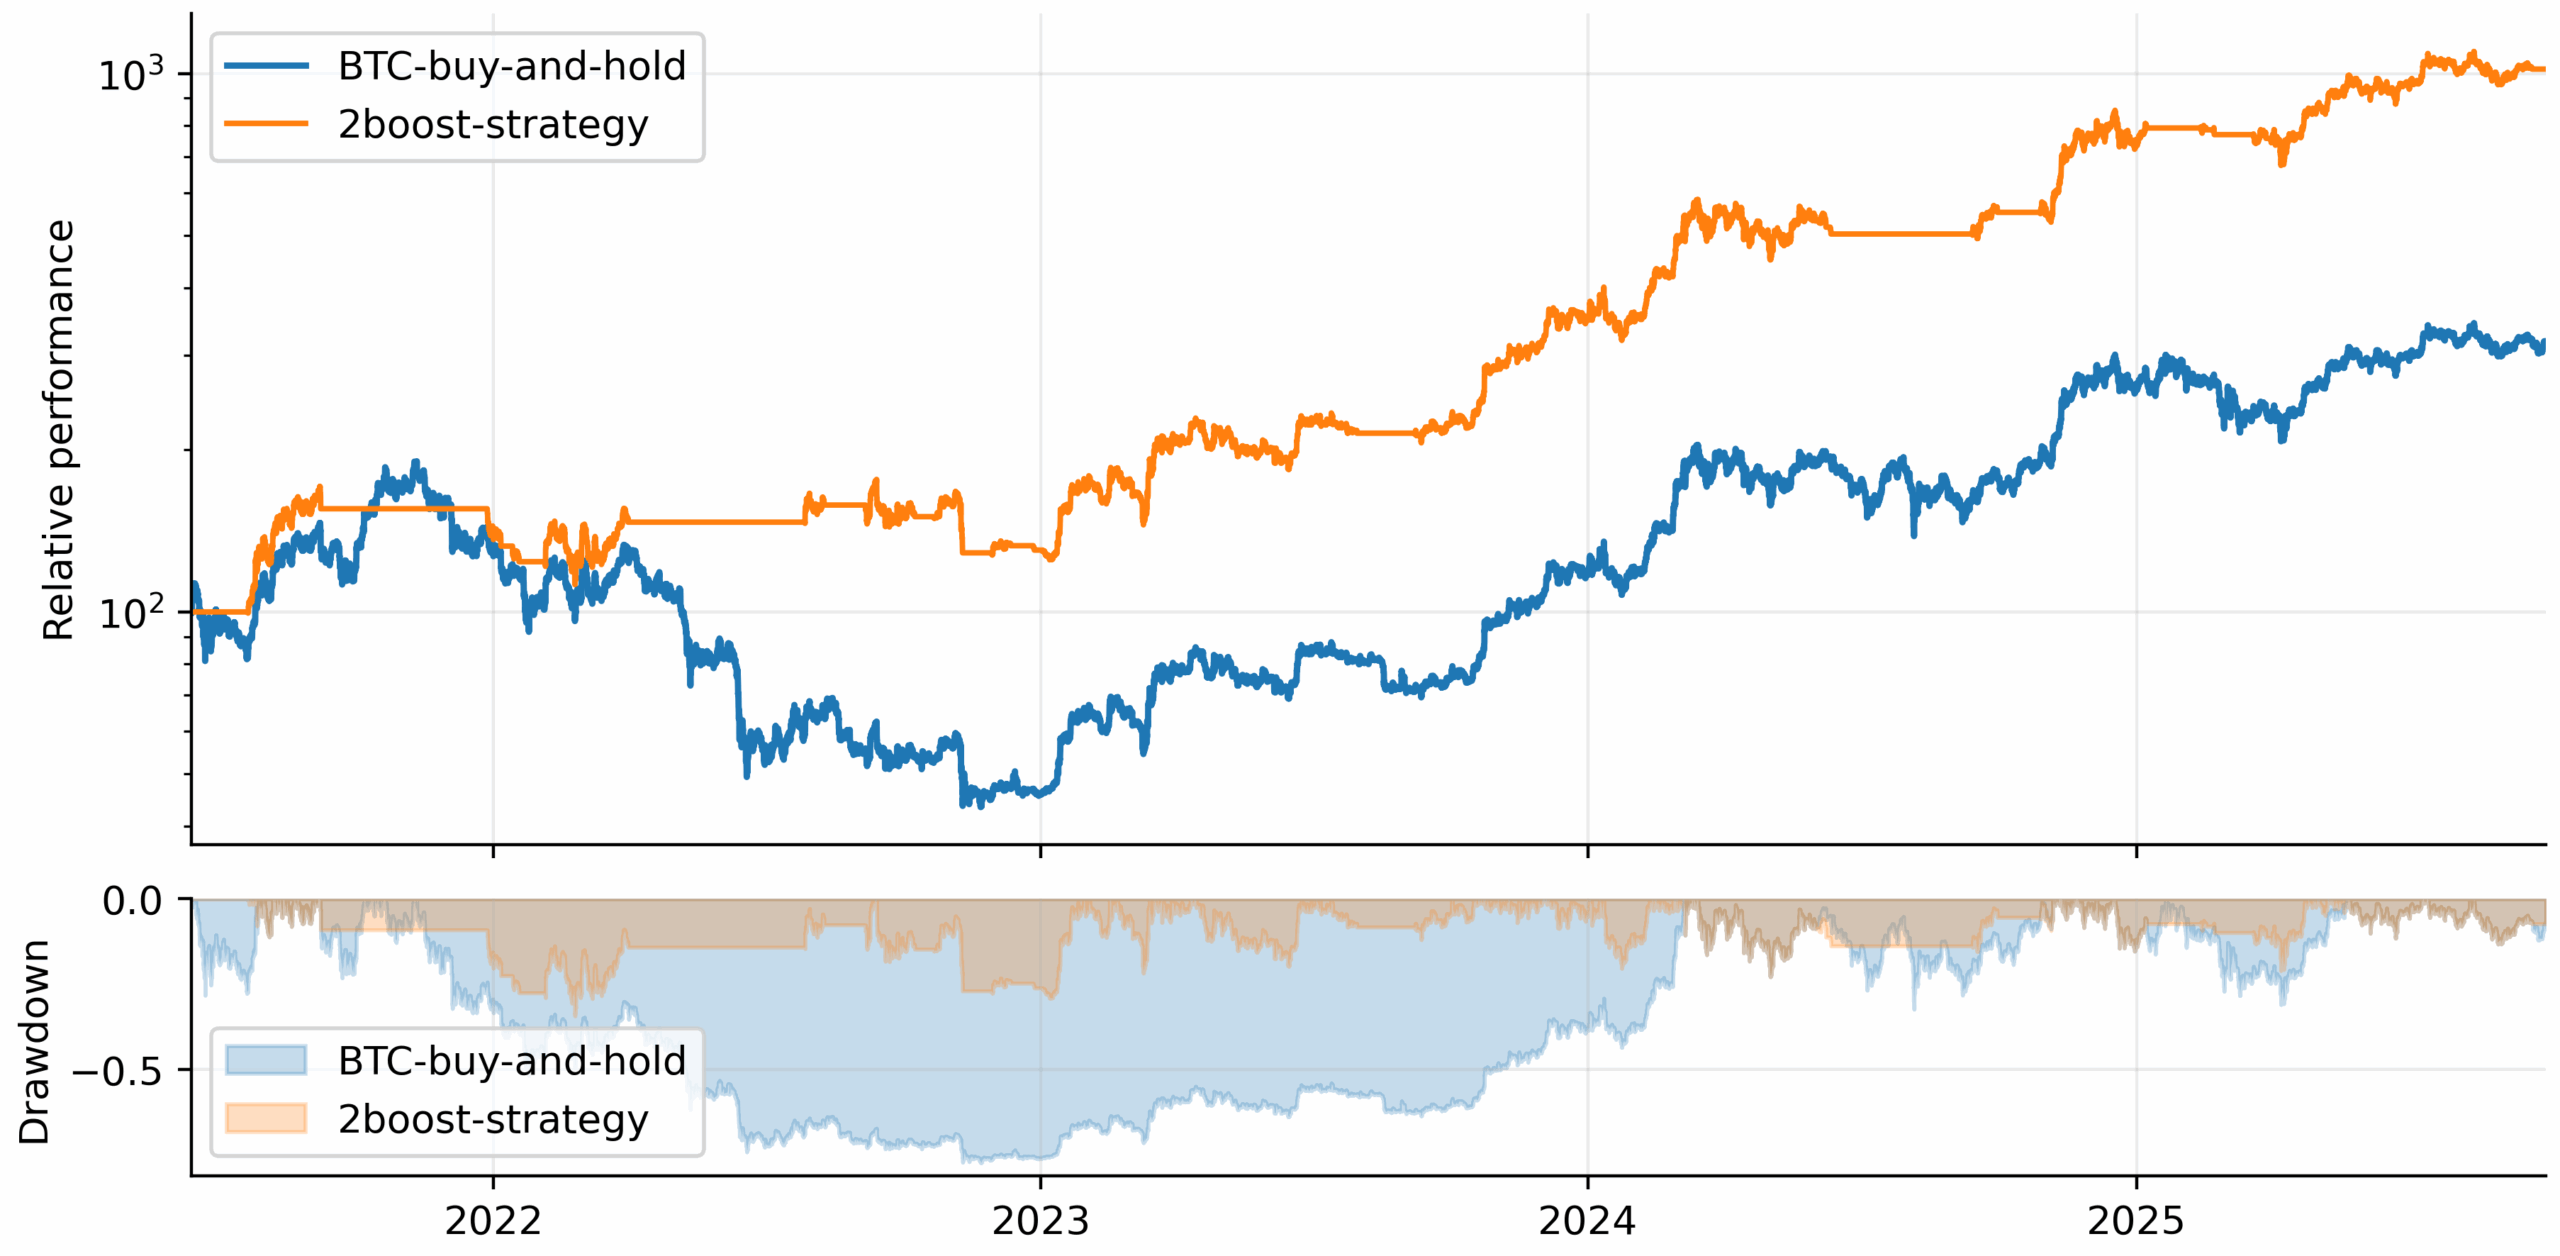
| Metric | Value |
|---|---|
| Profit Factor | 7.51 |
| Maximum Drawdown | 34.26% |
| Sharpe Ratio | 1.26 |
| Annualized Return | 71.60% |
| Total Trades | 25 |
Out-of-Sample Testing
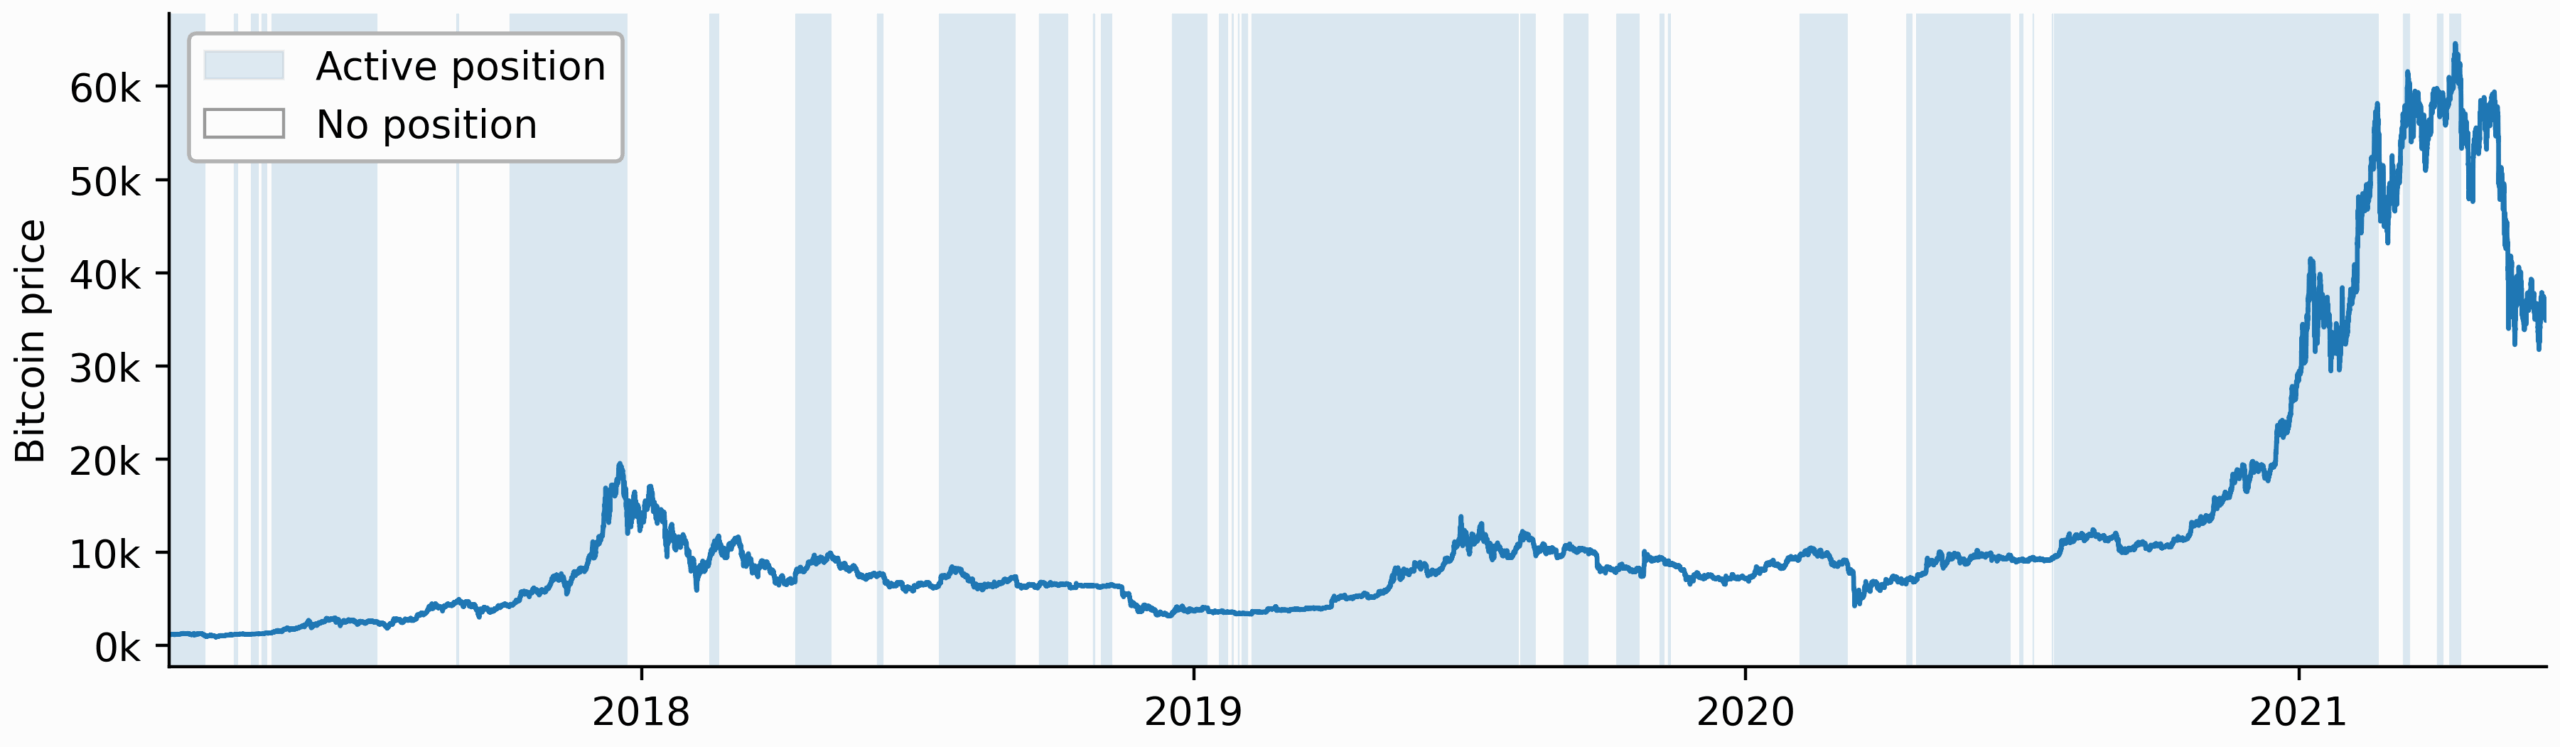
Period: 22 Feb 2017 – 13 Jun 2021
To prevent curve-fitting, we tested the model on unseen data from previous cycles, including the 2017 bull run and the 2018/2020 crashes.
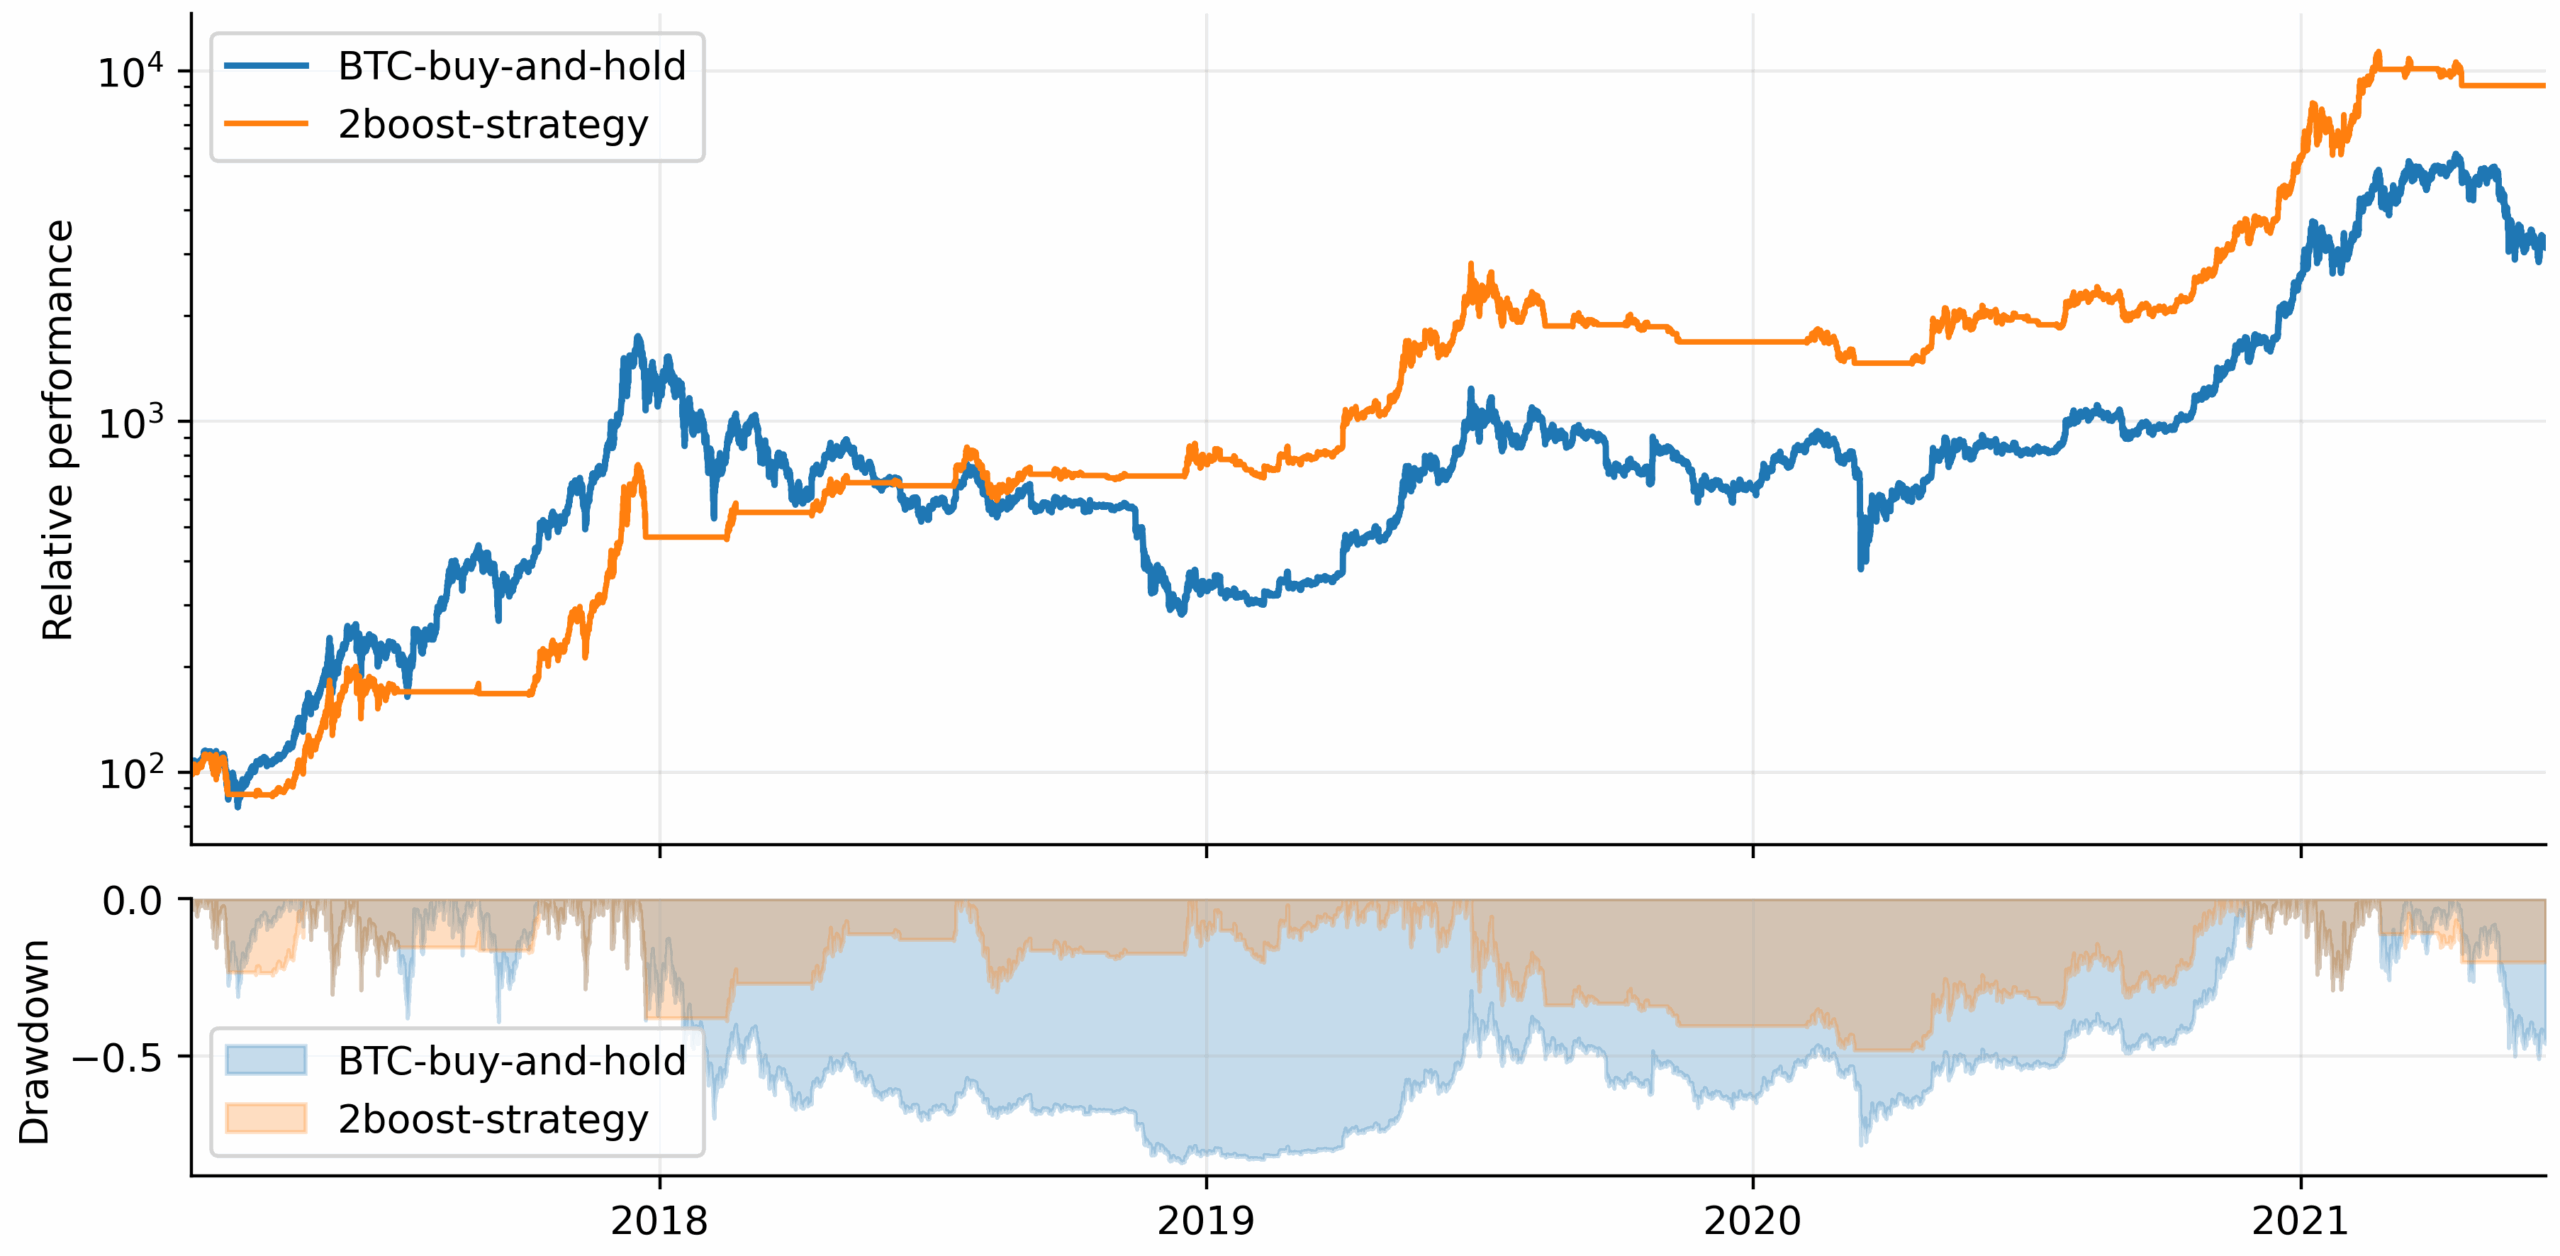
| Metric | Value |
|---|---|
| Profit Factor | 5.44 |
| Maximum Drawdown | 48.36% |
| Sharpe Ratio | 1.74 |
| Annualized Return | 184.96% |
| Total Trades | 35 |
Disclaimer: Backtests are based on historical data and assume ideal execution conditions. Real-world results may differ due to market conditions, liquidity, and execution constraints.