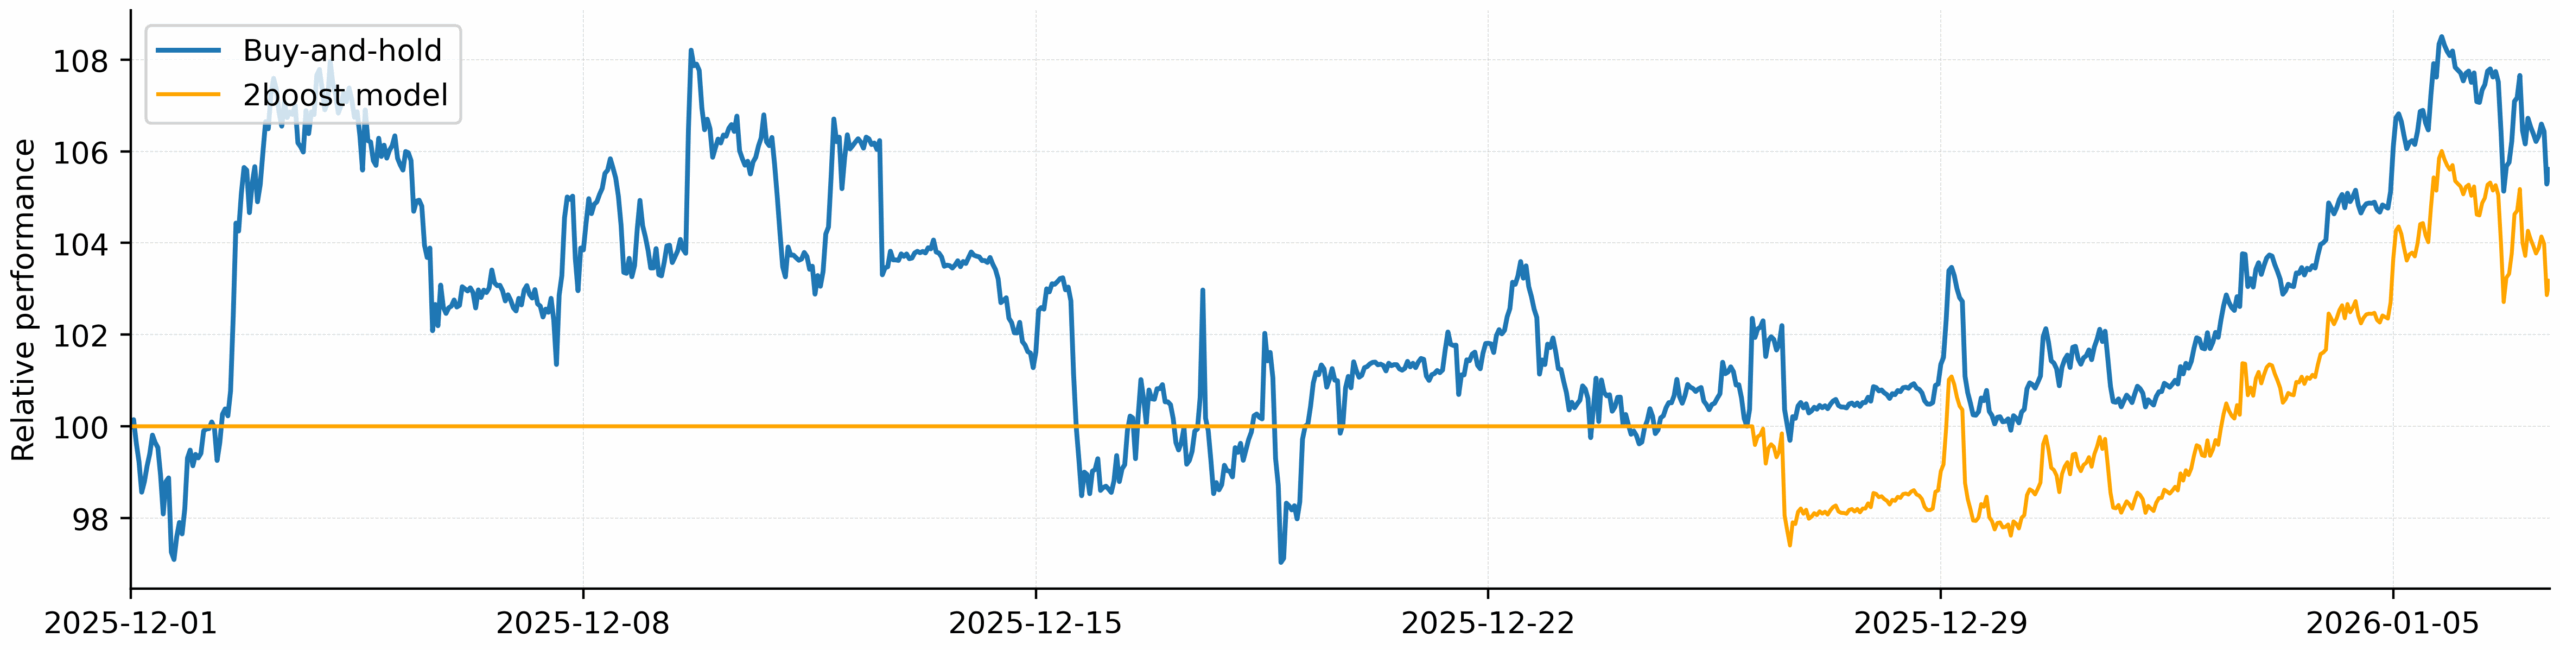
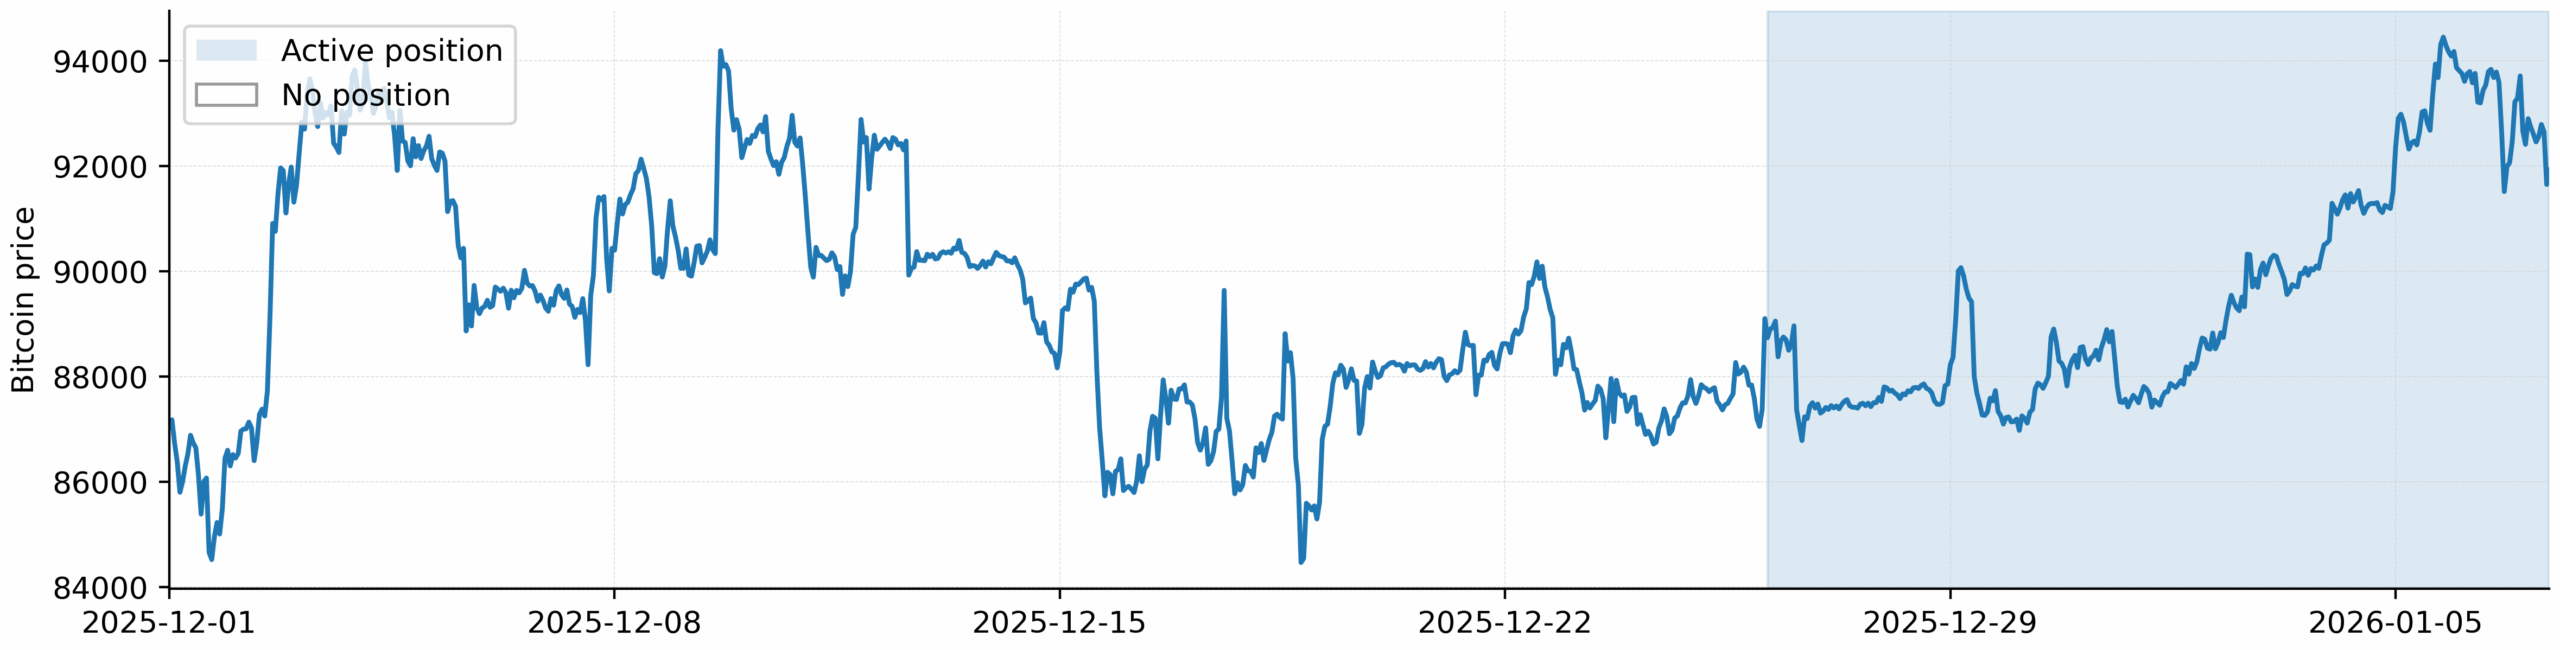
The live state of the Bitcoin strategy, including performance, market exposure, and recent trade activity, as executed on the Kraken exchange.
| Date | Type | Asset | Price (USD) |
|---|---|---|---|
| 2025-12-26 | Buy | XBTUSD | 89173.7 |
Disclaimer: The live state shown here is provided for informational purposes only. It does not constitute financial advice or a guarantee of future performance. Trading digital assets involves risk, including the potential loss of capital.